SPECTRA.FREESHELL.ORG
Status
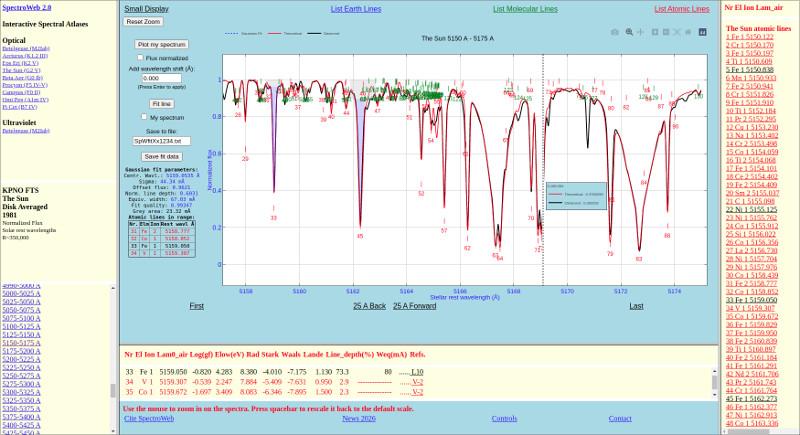
Controls
News
Publications
Development Team
The Interactive Database of Spectral Standard Star Atlases
Enter SpectroWeb 2.0
SpectroWeb 2.0 Controls
Help pages are under construction. Coming Soon. Stay tuned